PalkovitsM+2-1971a
Notes about [PalkovitsM+2-1971a] 1.
- 1(1,2)
M Palkovits, P. Magyar, and J. Szentagothai. Quantitative histological analysis of the cerebellar cortex in the cat. i. number and arrangement in the space of the purkinje cells. Brain Research, pages 13, 1971. Notes: PalkovitsM+2-1971a.html (this file).
This paper has data about the Purkinje cells in the cat cerebellum.
From page 9: Quantitative parameters are as follows: (a) the Purkinje cell density in the flat part of the folium is 384/sq.mm and the cortical surface area/Purkinje cell is 2604 sq.um; (b) the width of the Purkinje cell dendritic tree (including the spaces between neighbouring dendritic arborizations) is 8.9/um and the dendritic spread is 292.5 um; and (c) the mean distance between Purkinje cells (centre of perikarya) is 51 /um.
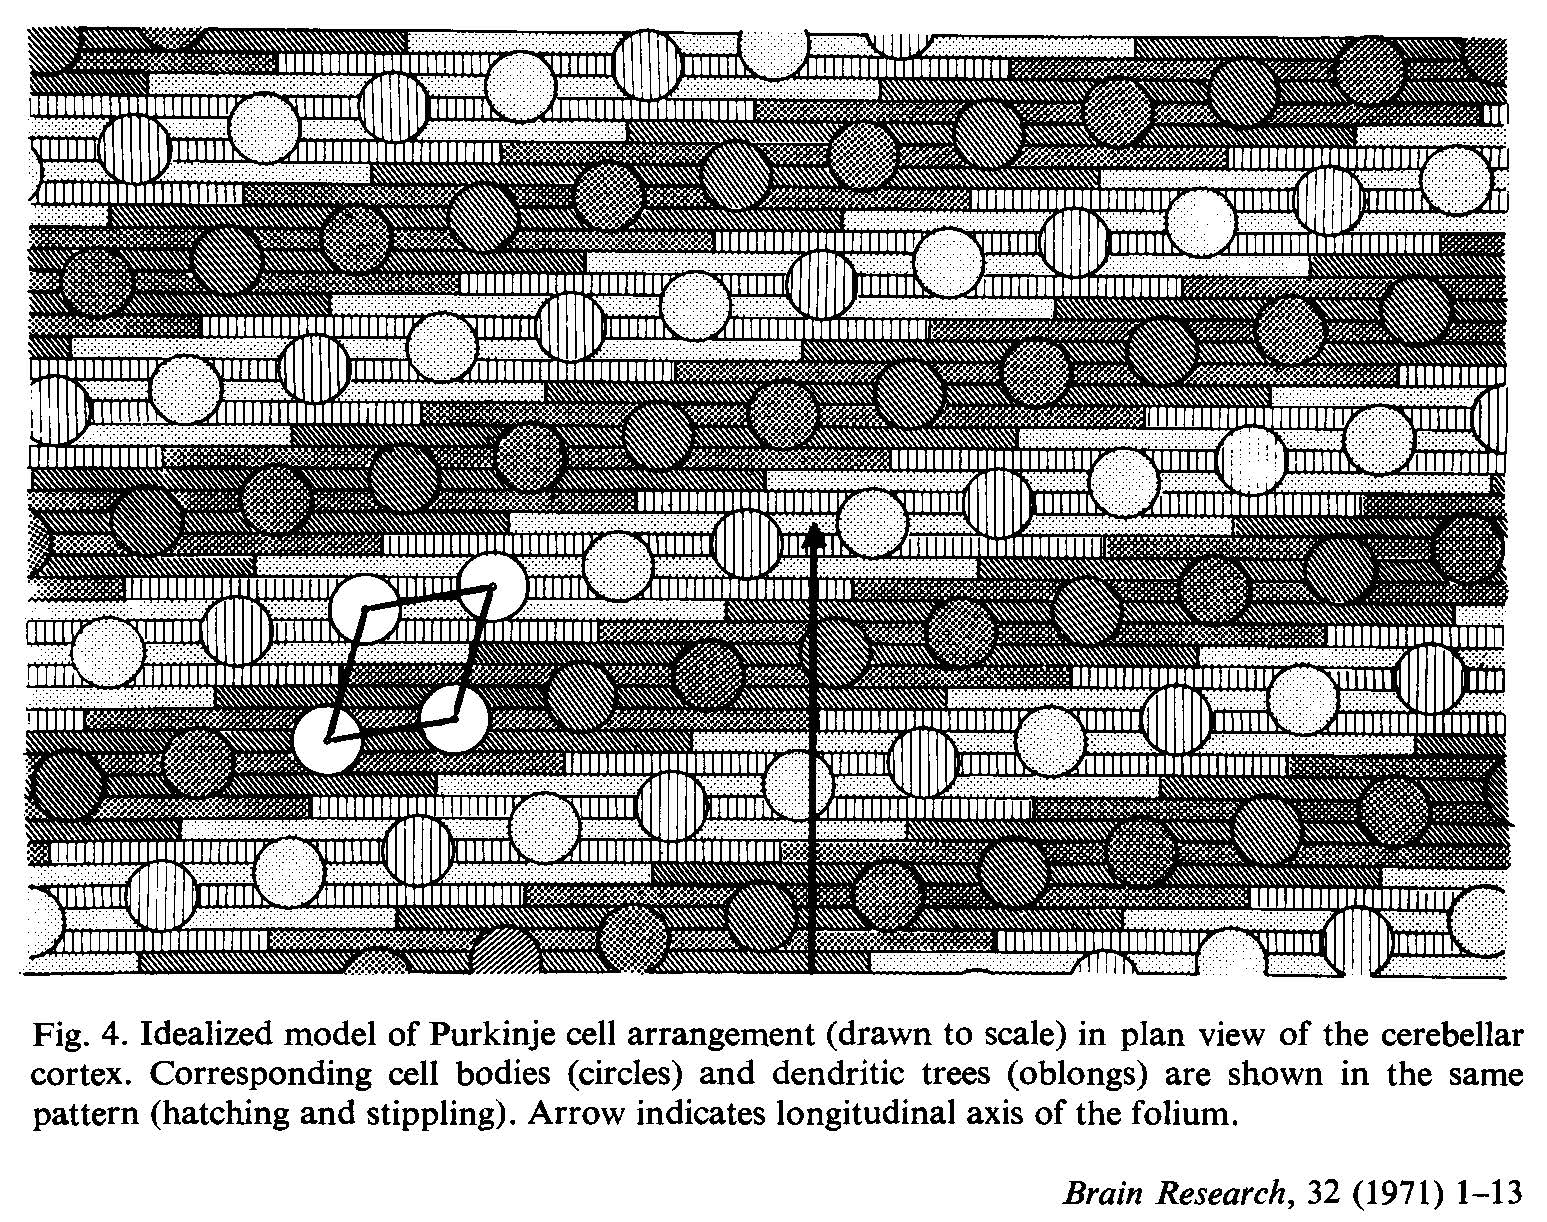
Figure 4 in PalkovitsM+2-1971a [PalkovitsM+2-1971a].
From Summary:
Purkinje cell numbers, densities and arrangement in space were studied by quantitative histology in the cerebella of adult cats. Calculated for the living state the density of the Purkinje cells was 373/sq.mm in entire folia (lobus paramedianus); the density in flattened parts of these folia was 384/sq.mm. The mean density calculated for the total living cerebellum was 330/sq.mm. The total number of Purkinje ceils was 1.2-1.3 million. On the basis of the known general principles of shape and arrangement in this study a new space arrangement model is suggested. Purkinje cell bodies are arranged in rows deviating by 11 ° from the transverse plane of the folium, and neighbouring cells are placed in a rhomboid pattern. In reality certain distortions of this pattern occur, in consequence of a flexibility in the relations of cell bodies to dendritic trees, but the essential correctness of the model can be proved statistically by distance measurements of Purkinje cells in randomly and in geometrically determined directions.
Data for table Cell counts in different species
The following table has data and references for table Cell counts in different species. Values are the number of cells of the given type in the specified species.
Id |
Cell type |
Species |
Value |
Reference |
|---|---|---|---|---|
p1 |
purkinje |
cat |
1.25 x 10^6 |
Range specified in the paper was 1.2-1.3 million. 1.25 million is the average.